
The world’s most important economic story can be told in a single line.
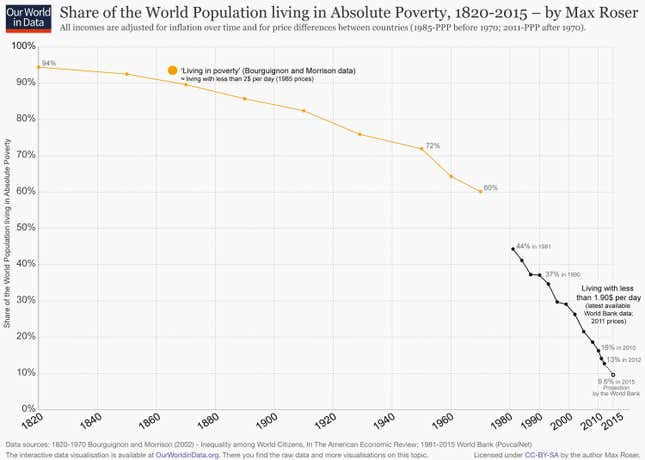
That’s pretty much what this year’s choice for Quartz’s Chart of the Year™ does. Threading together data sets from academic economists and the World Bank, Oxford economic researcher Max Roser quickly and clearly lays out a heartening economic trendline that many may find surprising: The proportion of poor people has shrunk sharply over the past two centuries.
“People just get it completely wrong,” says Roser, of the expectation that poverty would be rising rather than shrinking. “People are very, very wrong about such super-important trends.”
The German-born researcher published the chart earlier this year as part of Our World in Data, an online project dedicated to economic visualizations of long-term economic time series. Roser and Our World in Data is based at Oxford’s Institute for New Economic Thinking.
The project, which grew out of an idea for a book, show long-term time series that aim, as Roser puts it, “to communicate all the changes that matter for our lives.”
He regularly publishes sometimes startling charts on health, growth, income distribution, education, war and education. Roser says his goal at the website is to pull helpful data out of heavily paywalled—and often unread—academic journals and get important research out to the public.
Our World in Data had some 1.5 million visits over the last year. Roser hopes to continue his work on Our World in Data over the next year. The project has largely been a one-man operation—though at times he has had a web developer and students lend a hand—and its funding is set to run out in June, Roser says.
“A lot of my motivation is just to bridge this gap,” he says. “I think there should be way more efforts [toward] making this knowledge available.”
It’s this focus on accessibility which sets Roser’s approach apart. In an age awash in charts, data visualizations and animated doodads, this chart is a great example of an uncluttered illustration. And it clearly and quickly explains what’s arguably the most important economic story in the world.
At the same time, Roser also stresses the limitations of data. There are uncertainties built around any economic estimates, and they can get especially large for data sets that attempt to replicated developments over large sweeps of time.
That said, the clear trend is that the share of the world’s population in poverty—defined as those who live on less than $1.90 a day—is shrinking sharply. And the trend has been supercharged thanks in part to the emergence of the Chinese economy over the last 30 years. All the same, nearly 10% of the globe remains in poverty. That’s some 700 million people.
That’s an important thing to keep in mind, Roser says. As is the fact that the massive progress seen in global economic conditions is not in any sense a preordained.
“Things are changing because we care about them, because we make change,” Roser says. “There’s nothing inevitable about this process.”